
User account menu
Main navigation
  • Topics
    • Customer Care
    • FDA Compliance
    • Healthcare
    • Innovation
    • Lean
    • Management
    • Metrology
    • Operations
    • Risk Management
    • Six Sigma
    • Standards
    • Statistics
    • Supply Chain
    • Sustainability
    • Training
  • Videos/Webinars
    • All videos
    • Product Demos
    • Webinars
  • Advertise
    • Advertise
    • Submit B2B Press Release
    • Write for us
  • Metrology Hub
  • Training
  • Subscribe
  • Log in
Mobile Menu
  • Home
  • Topics
    • 3D Metrology-CMSC
    • Customer Care
    • FDA Compliance
    • Healthcare
    • Innovation
    • Lean
    • Management
    • Metrology
    • Operations
    • Risk Management
    • Six Sigma
    • Standards
    • Statistics
    • Supply Chain
    • Sustainability
    • Training
  • Login / Subscribe
  • More...
    • All Features
    • All News
    • All Videos
    • Contact
    • Training

Converting Capabilities

What difference does the probability model make?

Donald J. Wheeler
Mon, 10/03/2022 - 12:03
  • Comment
  • RSS

Social Sharing block

  • Print
  • Add new comment
Body

Last month we found that capability and performance indexes have no inherent preference for one probability model over another. However, whenever we seek to convert these indexes into fractions of nonconforming product, we have to make use of some probability model. Here, we’ll look at the role played by probability models when making these conversions.

ADVERTISEMENT

Many people have been taught that the first step in the statistical inquisition of their data is to fit some probability model to the histogram. Here we’ll begin with the 250 values shown in figure 1. These values have an average of 7.4 and a standard deviation statistic of 5.2.


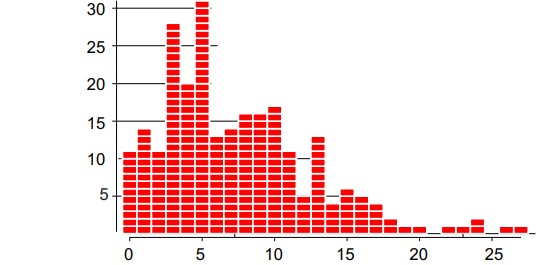
Figure 1: 250 observations from one process

 …

Want to continue?
Log in or create a FREE account.
Enter your username or email address
Enter the password that accompanies your username.
By logging in you agree to receive communication from Quality Digest. Privacy Policy.
Create a FREE account
Forgot My Password

Comments

Submitted by dangermoney on Tue, 10/18/2022 - 10:36

Excellent clarifying examples

Digging the new photo, Dr. Wheeler. 

And I absolutely love this content.

Such a detailed exploration that is subsequently summed up very nicely: "The numerically naive think that two numbers that are not the same are different. But statistics teaches us that two numbers that are different may actually be the same."

  • Reply

Add new comment

11 + 5 =
Solve this simple math problem and enter the result. E.g. for 1+3, enter 4.
Please login to comment.
      

© 2024 Quality Digest. Copyright on content held by Quality Digest or by individual authors. Contact Quality Digest for reprint information.
“Quality Digest" is a trademark owned by Quality Circle Institute Inc.

footer
  • Home
  • Print QD: 1995-2008
  • Print QD: 2008-2009
  • Videos
  • Privacy Policy
  • Write for us
footer second menu
  • Subscribe to Quality Digest
  • About Us
  • Contact Us